TfL have been nice enough to release a data set showing how busy trains are – the train loading.
They use a 6 point scale to measure the busy-ness:
| Scale | Definition | Actual measure on train |
| 1 | Very quiet | zero to all seats taken |
| 2 | Quiet | 0 to 2 customer per m2 |
| 3 | Fairly busy | 2 to 3 customers per m2 |
| 4 | Busy | 3 to 4 customers per m2 |
| 5 | Very busy | 4 to 5 customers per m2 |
| 6 | Exceptionally busy | > 5 customers per m2 |
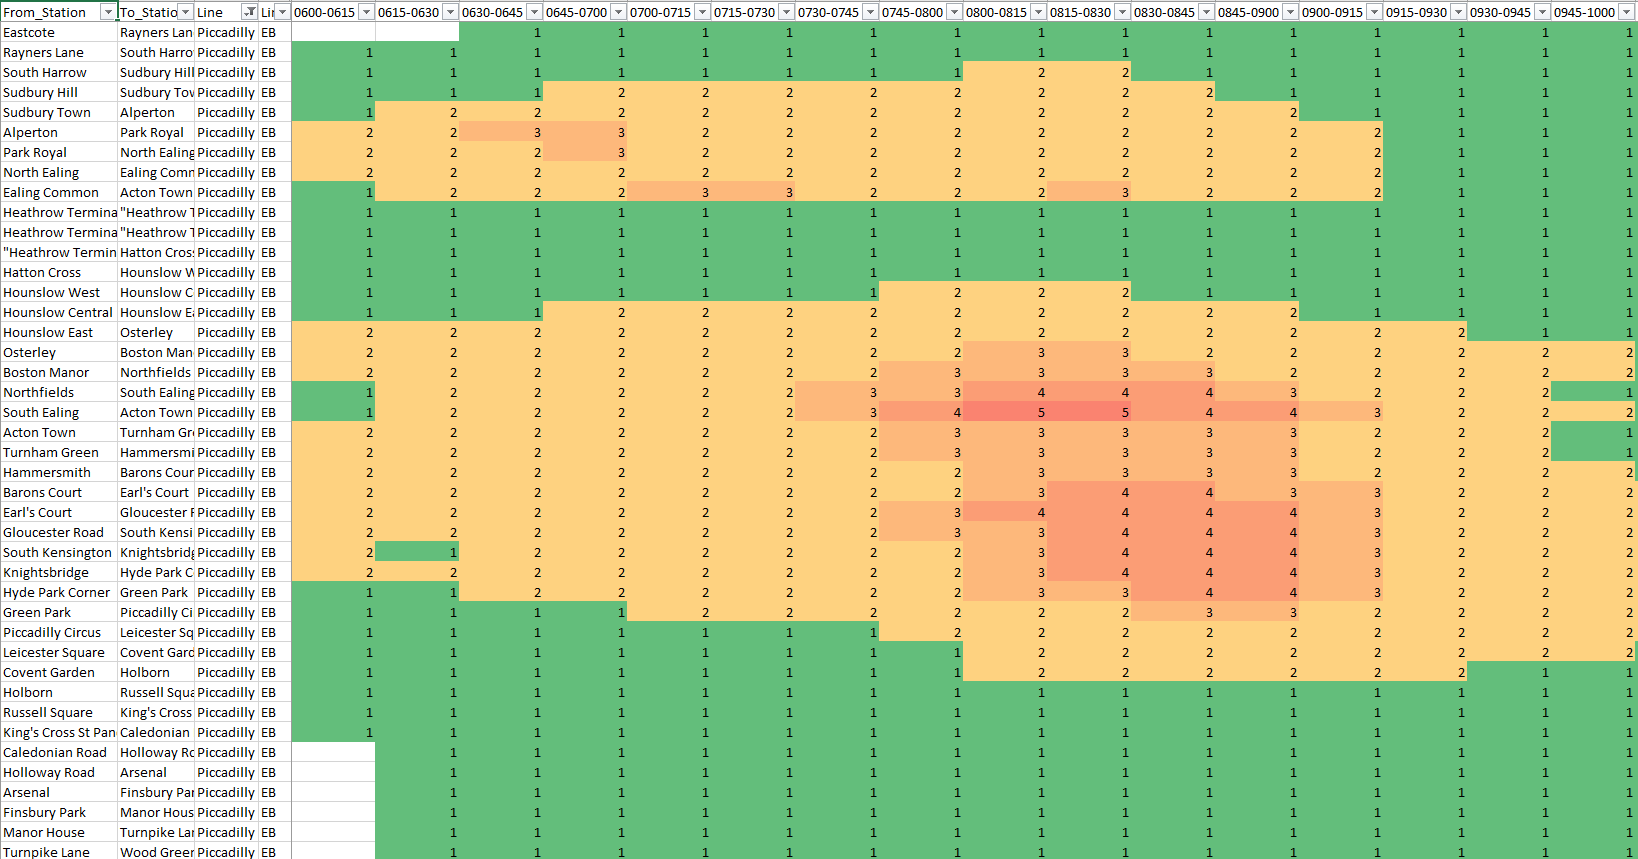
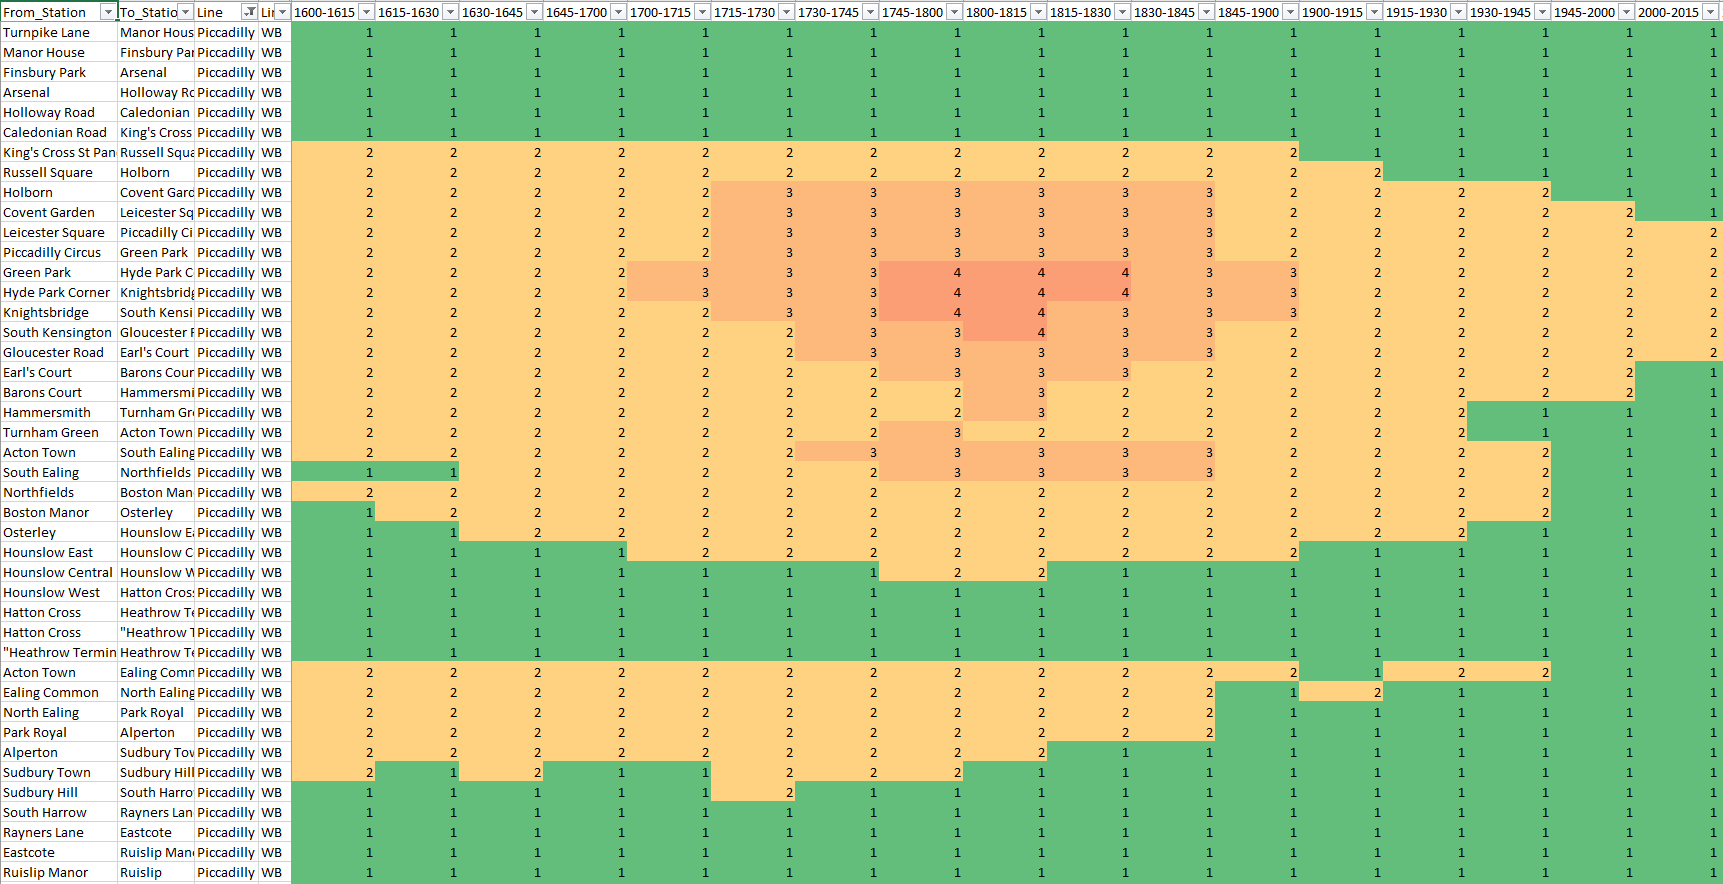
As I live in West London and work in Central London I’m interested in morning eastbound and evening westbound travel.
So, bad luck if you want to get on a train at South Ealing towards Acton Town between 0800 & 0830:
In the evening it’s very busy from central London westwards between 1745 & 1830, although once you get to Gloucester Road you stand more of a chance of getting on:
The numbers seem to suggest that the loading to Rayner’s Lane is the same as Heathrow destined trains; in my experience this isn’t borne out. The data gives a hint towards this in that Acton > Northfields trains are busier for the same time window, but I wonder whether the lower frequency of Uxbridge trains skews this a bit.
Hopefully this gives you an idea of your chances of getting on a train in the morning – I’d love to see this baked into Citymapper.